It’s that time of year again, when you’ll see employees of EcoPoint out in the field monitoring to document reclamation success. By getting boots on the ground and surveying the vegetation on each pad individually, the team identifies reclamation needs and answers client questions through informed data collection, analysis, and presentation.
EcoPoint has implemented a reclamation monitoring method developed at the University of Wyoming by Michael Curran PhD (Curran et. al.1). During this phase of the reclamation process, EcoPoint surveys 20 photos found within the pad’s reclamation area along with 20 photos on the adjacent undisturbed landscape. By taking both sets of photos for each pad, the team is able to compare and contrast the vegetation growth and variety.
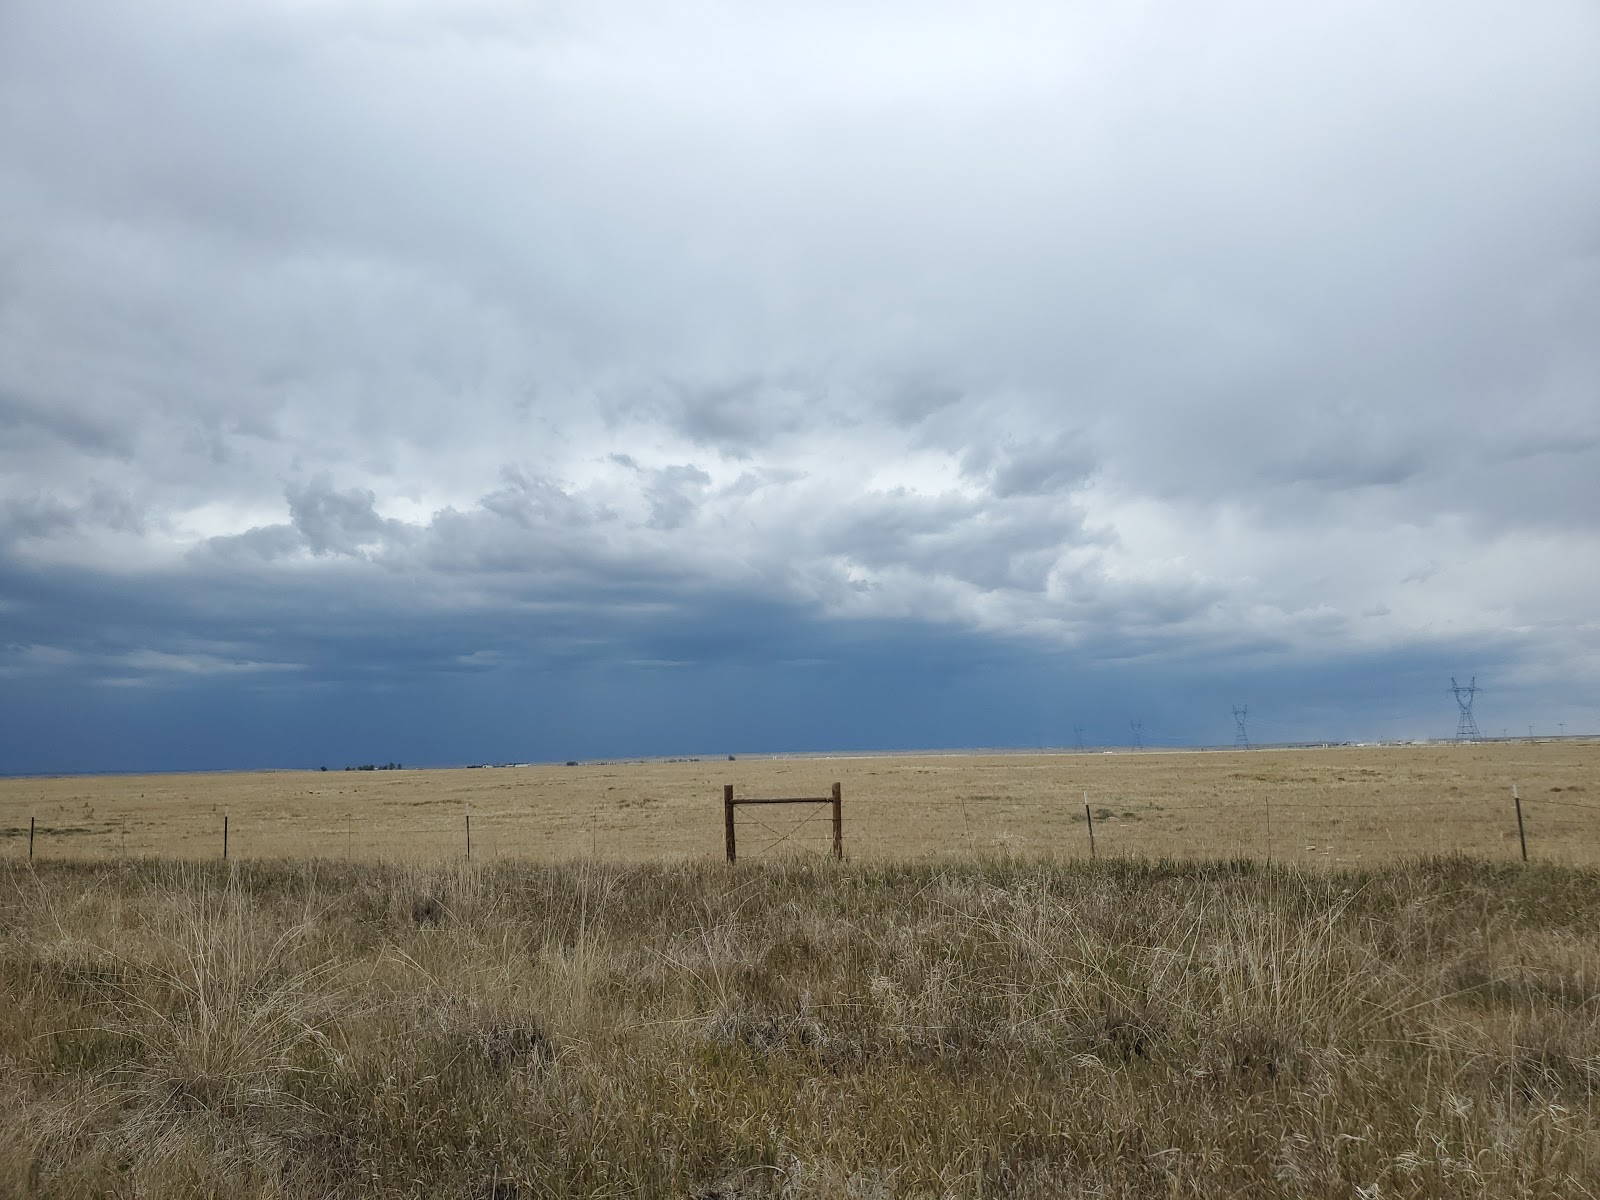
Photo by Allison Rubendall in Hereford, CO
Above is a photo that depicts the reclamation area in the foreground with the adjacent vegetation in the background, separated by a fence used to keep wildlife and livestock off of the pad and reclamation area while they are active.
After quantitative data collection finishes for the summer, EcoPoint moves into the next phase. The teams move out of the field and into the office to analyze the collected photos. Using SamplePoint analysis, each photo taken on the pads is classified into 15 snapshots to identify the foliage more accurately and calculate percent cover of all of the elements of both reclamation and adjacent areas. This process helps EcoPoint and clients get a good picture of how the reclamation is doing and where it can go next.
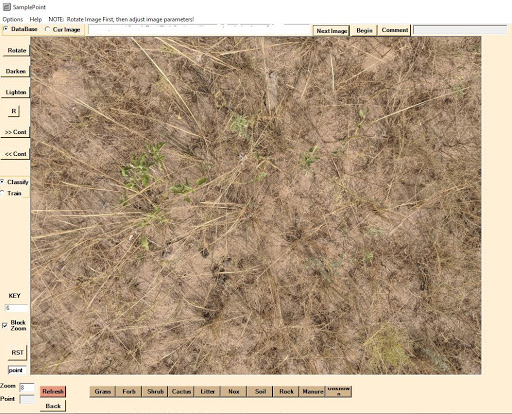
Above is an example of a photo point collected in the field. We analyze these photos by breaking each point down into 15 randomly generated cross sections for analysis. As you can see, the key towards the bottom of the photo shows the nine classifications, or cover types, that are applied to the vegetation.
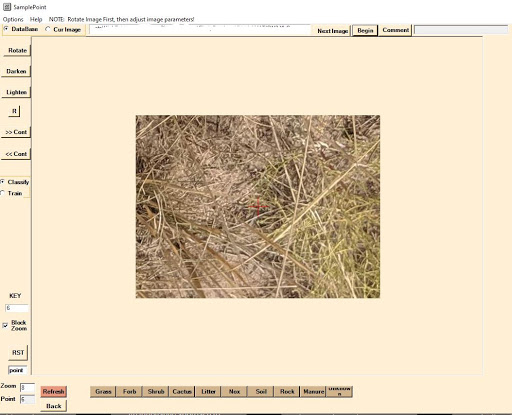
Above is one of the 15 cross sections analyzed when compiling data. The red crosshair in the center of the photo is the point where the identification occurs. The cross section will be identified as grass, forb, shrub, cactus, litter, noxious weed, soil, rock, manure, or unknown. This point then populates in a spreadsheet that will calculate the percentage of each cover type on each pad. This provides clients with essential information about each pad and how to compares to the adjacent undisturbed areas.
Through SamplePoint analysis, EcoPoint and clients are provided with statistical information to track the progress of the reclamation efforts on each pad. Through Colorado Oil and Gas Conservation Commission (COGCC), in order for the reclamation of the area to be released and deemed successful, it must match at least 80% of the adjacent undisturbed vegetation or meet pre-reclamation expectations. This monitoring is conducted yearly so that continual progress can be achieved. Should a site require re-evaluation due to erosion, new construction, or reclamation not being achieved, soil amendments or reseeding are common recommendations to move the reclamation process forward.
- Curran, M. (2019) Spatially balanced sampling and ground‐level imagery for vegetation monitoring on reclaimed well pads. Restoration Ecology, 27(5), 1061-2971 https://doi.org/10.1111/rec.12956
Recent Comments